Case study · Website and product design

DefiMetrics.

A DeFi analytics dashboard that treats dense data like it deserves good typography.

Terminal energy.

Crypto dashboards tend toward Bloomberg-terminal density or over-designed gradients. DefiMetrics splits the difference — near-black, one orange, and room for eight-figure numbers to breathe.

The brief, in short

Project details.

Objectives

  • Launch a DeFi analytics dashboard that treats dense data like it deserves good typography
  • Split the difference between Bloomberg-terminal density and over-designed gradients
  • Keep dozens of unrelated numbers reading as one connected system, not a wall of stats

Key Services

  • Website design & build
  • Product / UI design for the dashboard and data cards
  • Brand identity — mountain-peak mark, colour system, motion

Stack

  • Next.js + React
  • Tailwind CSS
  • Framer Motion
  • Vercel

The look

Terminal energy, without the eye strain.

Crypto-native dashboards tend toward either pure Bloomberg-terminal density or over-designed gradients. DefiMetrics splits the difference: a near-black canvas, a single confident orange accent, and cards with enough breathing room that eight-figure numbers don’t feel like they’re shouting.

The mountain-peak mark in the logo doubles as the accent’s whole personality — it shows up again in sparkline charts and the trending-token list, so the dashboard reads as one system even while tracking dozens of unrelated numbers at once.


The palette

  • Signal orange#FF6A2B
  • Near-black#09090A
  • Elevated panel#1C1C1F
  • Off-white text#F3F3F1

A closer look

Inside the dashboard.

The same legible terminal, on every screen.

01 / 03
defimetrics.com
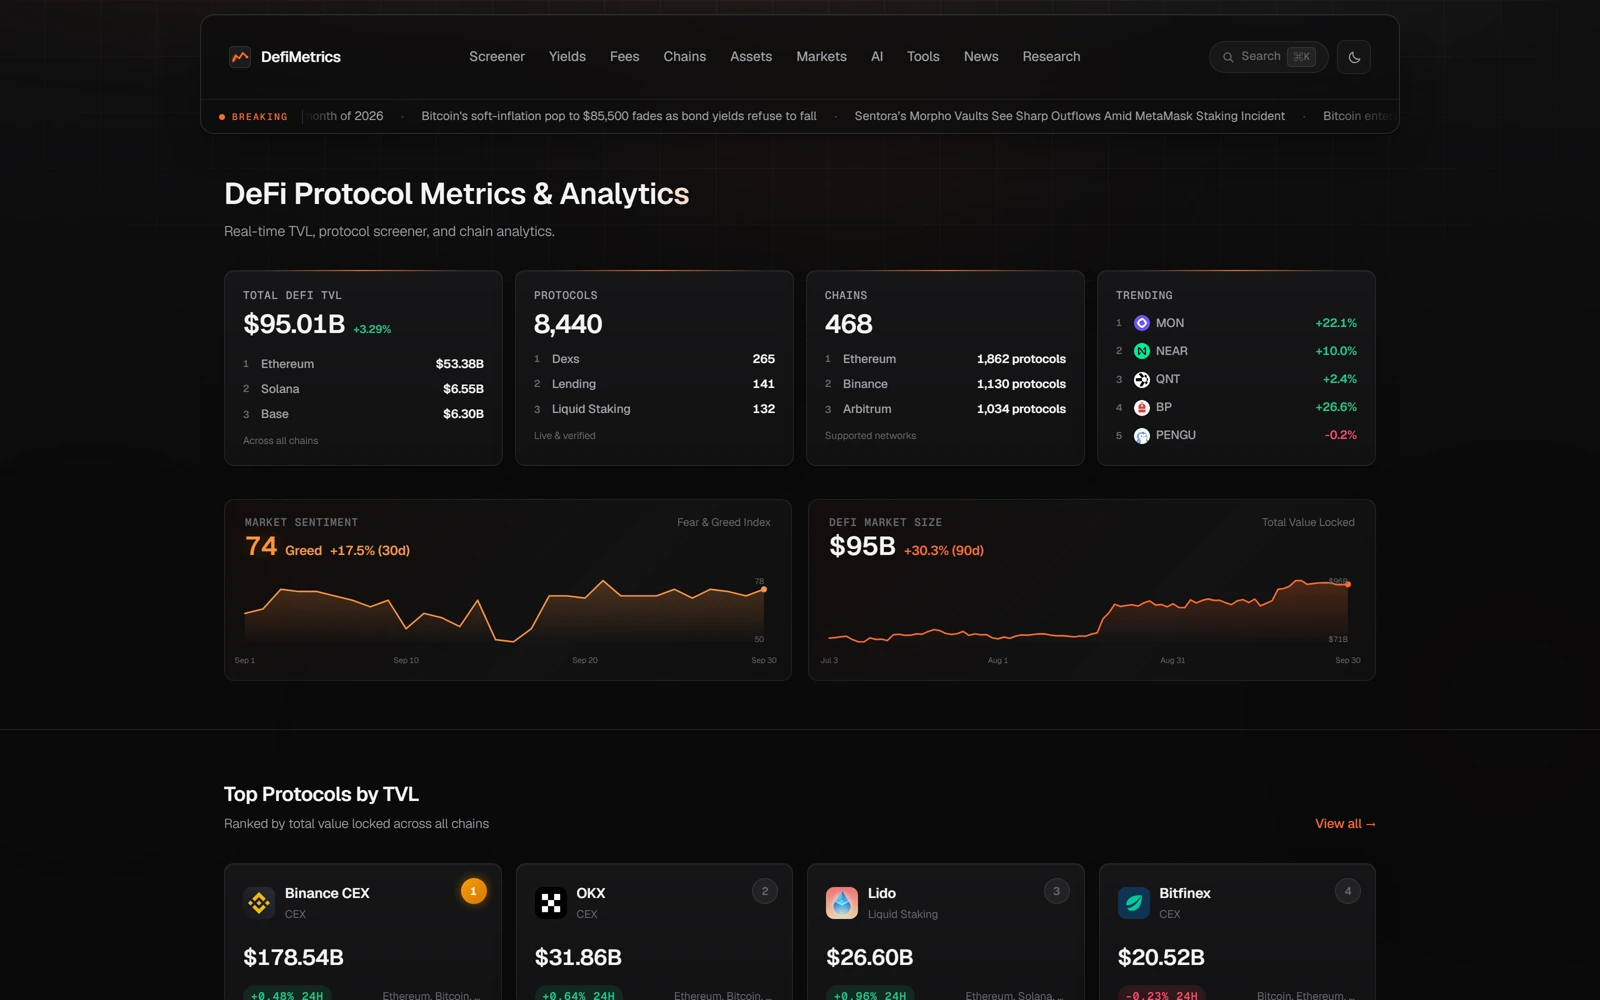
DefiMetrics' dashboard: total DeFi TVL, protocol and chain stat cards, and trending tokens
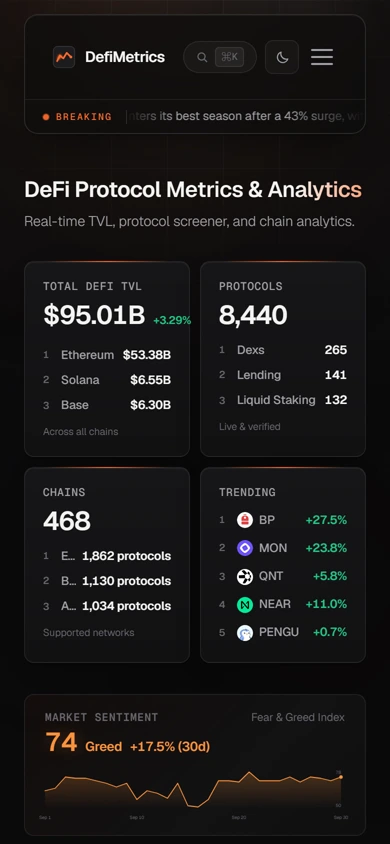
The same dashboard on mobile, cards stacked into a single scannable column
defimetrics.com
DefiMetrics' dashboard: total DeFi TVL, protocol and chain stat cards, and trending tokens
The same dashboard on mobile, cards stacked into a single scannable column

Three choices that carry the whole page

What makes it work.

  1. CHOICE 01

    One accent, used everywhere

    Orange marks the logo, the positive-movement numbers and the sparkline fills — a single colour doing triple duty instead of a rainbow of competing chart colours.

  2. CHOICE 02

    Cards, not walls of numbers

    TVL, protocols, chains and trending tokens are each their own bordered card rather than one dense table, so the eye has somewhere to land before comparing numbers.

  3. CHOICE 03

    A news ticker that doesn’t shout

    Live headlines scroll in a quiet, low-contrast bar under the nav — present for anyone who wants it, easy to ignore for anyone who doesn’t.

The process behind the page, start to finish

How we got there.

  1. 01

    Retained.

    DefiMetrics brought us on to take a crypto-native analytics dashboard and give dense data the typography it deserves.

  2. 02

    Meetings.

    A handful of calls to understand which numbers — TVL, protocols, chains, trending tokens — actually needed top billing.

  3. 03

    Concept.

    The single confident orange accent and mountain-peak mark came out of this stage — one colour doing triple duty instead of competing chart colours.

  4. 04

    Architecture.

    Dozens of unrelated numbers, one connected system — cards with room to breathe instead of a single dense wall of stats.

  5. 05

    Wireframes.

    Low-fidelity layouts to test the pacing — headline stats, charts, protocol rankings — before the final visual language was applied.

  6. 06

    Finished build.

    A near-black canvas, breathing room around eight-figure numbers, and a news ticker that's easy to ignore if you want to.

Your move

Want a dashboard this legible?