Case study · Website

The Loudness Database.

A free reference database for LUFS, true peak and dynamic range — built like a music-nerd’s Wikipedia.

Nothing to sell.

A free reference for LUFS, true peak and dynamic range. No sales pitch, because there’s nothing to sell — just a music nerd’s Wikipedia.

The brief, in short

Project details.

Objectives

  • Launch a free public reference tool that reads as authoritative, not promotional
  • Turn a raw measurement database into something worth reading, not just querying
  • Let visitors browse with no idea what they're looking for yet, not just search

Key Services

  • Website design & build
  • Product / UI design for the database and data tables
  • Brand identity — logo mark, colour system, motion

Stack

  • Next.js + React
  • Tailwind CSS
  • Framer Motion
  • Vercel

The look

Reference-tool honesty.

There’s no sales pitch anywhere on this page, because there’s nothing to sell — it’s a public reference tool, and the design gets out of the way of that job: a dark, quiet background, one green accent circling back to the logo mark, and dense, well-organized data tables instead of marketing copy.

The one genuinely editorial touch is the featured-story card — a real before/after loudness analysis of a specific remaster, complete with album art and measured numbers. It’s the difference between a spreadsheet and a publication.

The palette

  • Database green#4ADE80
  • Deep black#0E0F12
  • Panel grey#1A1C21
  • Data white#FFFFFF

A closer look

Inside the database.

The same quiet database, on every screen.

01 / 03
lufs.to
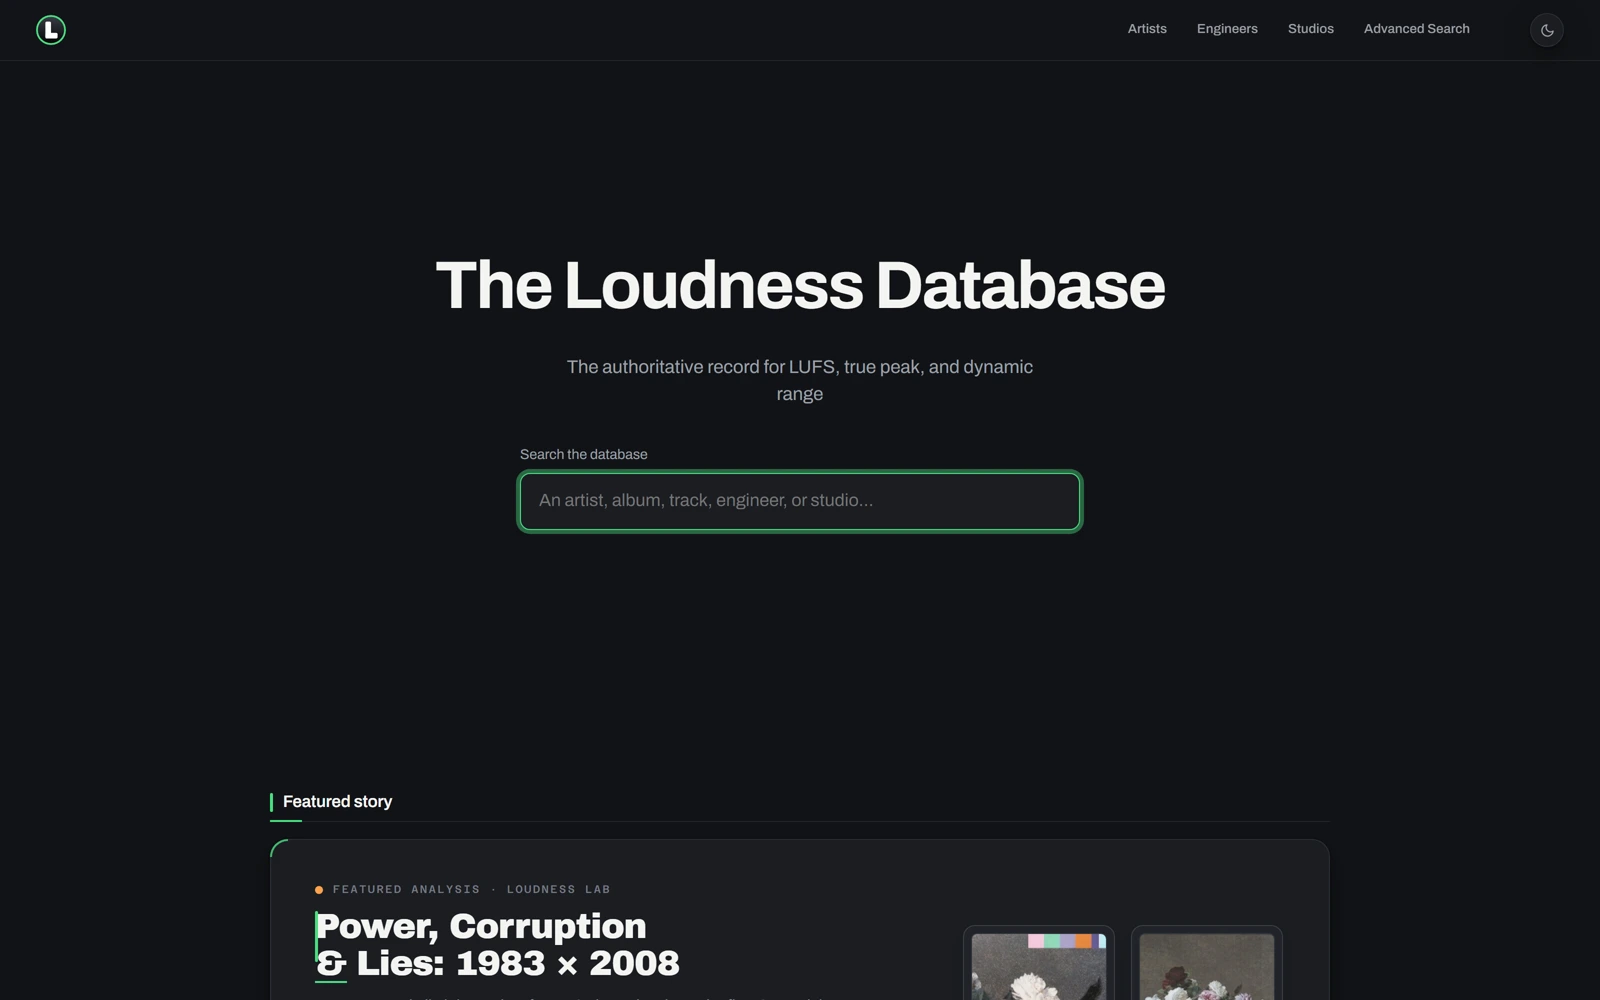
The Loudness Database's homepage: the search bar and the Power, Corruption & Lies featured-story card
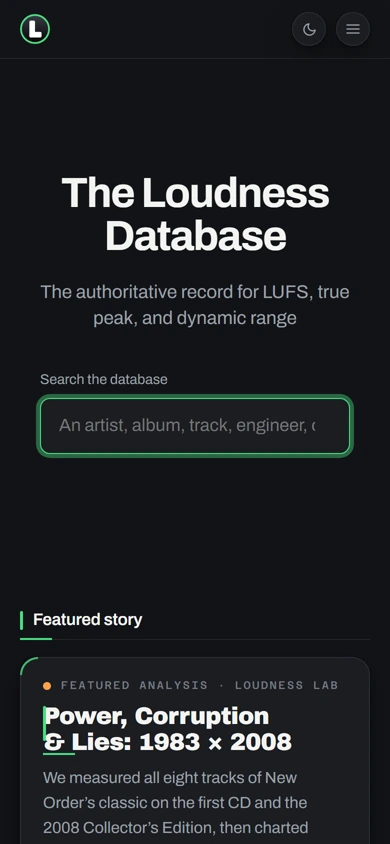
The same homepage on mobile, search and featured story stacked
lufs.to
The Loudness Database's homepage: the search bar and the Power, Corruption & Lies featured-story card
The same homepage on mobile, search and featured story stacked

Three choices that carry the whole page

What makes it work.

  1. CHOICE 01

    A featured story, not just a table

    A real editorial comparison — “Power, Corruption & Lies: 1983 × 2008” — with album art and measured LUFS numbers sits right under the hero, turning a raw database into something worth reading, not just querying.

  2. CHOICE 02

    Browsable, not just searchable

    Genre-and-decade tiles and a most-represented-engineers grid let a visitor explore the database with no idea what they’re looking for yet — most reference tools only support visitors who already know exactly what to search.

  3. CHOICE 03

    A logo mark that does the branding

    A single circular green glyph, echoed in the accent colour throughout, does all of the brand’s visual work — no wordmark treatment or gradient required.

The process behind the page, start to finish

How we got there.

  1. 01

    Retained.

    The Loudness Database brought us on to take a raw measurement spreadsheet and give it a home people would actually return to.

  2. 02

    Meetings.

    A handful of calls to understand LUFS, true peak and dynamic range well enough to design around the data honestly.

  3. 03

    Concept.

    The single circular green glyph and near-black register came out of this stage — a reference tool, not a product with something to sell.

  4. 04

    Architecture.

    Searchable and browsable, one connected database instead of a form that only rewards people who already know what to look for.

  5. 05

    Wireframes.

    Low-fidelity layouts to test the pacing — search, featured story, browse tiles — before any of the final visual language was applied.

  6. 06

    Finished build.

    A dark, quiet background and dense, well-organized tables that read as a publication, not a spreadsheet.

Your move

Want a reference tool people actually return to?